Key words:
Liquidity Mining, Token Distribution, Updated Emission.
Summary:
Updating the emission curve with a less aggressive schedule for distribution
Context:
APWine tokenomics were brought to life during early 2021, they were based on the Curve model and we naturally thought of using a pretty similar emission schedule to Curve for the APW token.
The market and the expectations of the community changed a lot in the meantime. We’d like to make the emission fairer for the involved members of the community such as holders but especially stakers. It is also a plus for the long term growth of the project.
Rationale:
The protocol is currently distributing a big amount of tokens since the start of the liquidity mining on the protocol Here is a breakdown of the DAO expenses and the % of the supply represented:
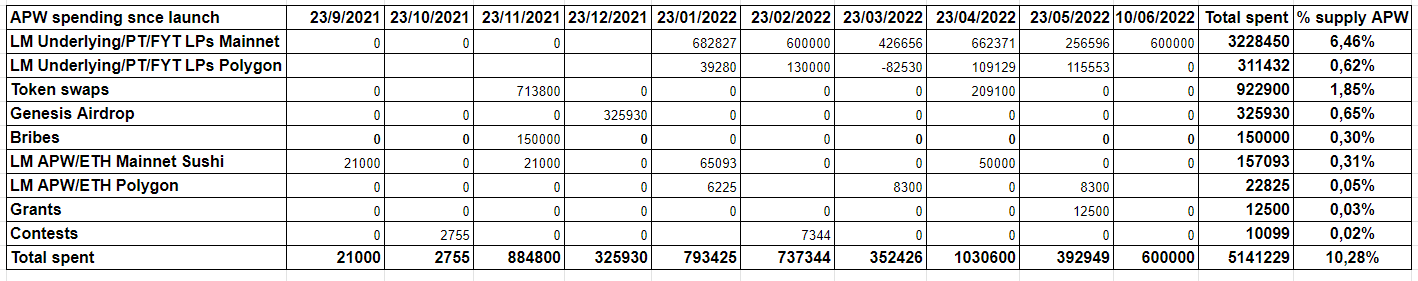
As you can see above, the DAO spent 6.46 + 0.62 = 7.08% of the total supply in liquidity mining in seven months, which represents 12.13% on a yearly basis at the current rate.
As you can see above, the liquidity mining is the biggest spending of the DAO, with an average of 141K APW/week. The initial idea was to be inspired from the following curve described here, while reducing the linear emission rate progressively. However, to ensure the sustainability of the protocol in the long terme,we want to update the rate to strictly follow the emission curve above, according to the formula proposed below:
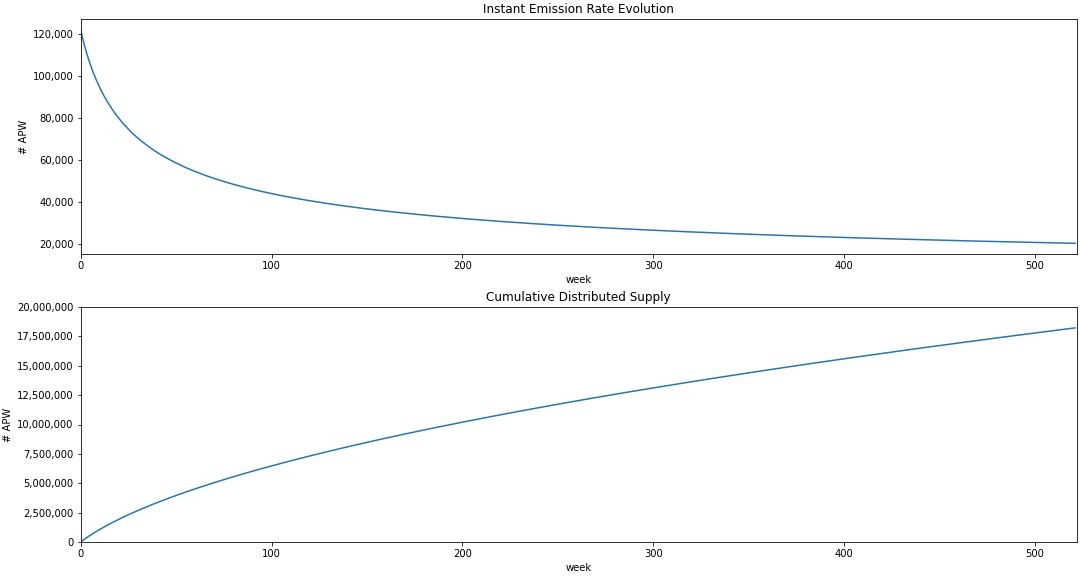
This is the results for the first 5 weeks of liquidity mining after the curve update :
week 1 : 120 051
week 2: 116 354
week 3: 112 979
week 4: 109 882
week 5: 107 027
Means:
Dev work
No budget required for this proposal.
Technical implementation:
The distribution would happen the same as with the previous emission curve.
Voting options:
- Yes, update the new emission
- No, do nothing
- Abstain
0 voters